Grafana
- Source: https://github.com/grafana/grafana
- License: AGPL 3.0
- UI:
https://grafana.<domain> - Credentials:
EXIST_USERNAME/EXIST_PASSWORD(set via.env.shared)
Visualization layer for Prometheus metrics and Loki logs. Everything is provisioned from code — no manual setup needed.
What's provisioned
| Resource | File | Purpose |
|---|---|---|
| Prometheus datasource | provisioning/datasources/prometheus.yaml | Default datasource, 15s scrape interval |
| Loki datasource | provisioning/datasources/loki.yaml | Log queries, max 1000 lines |
| Decree Overview dashboard | provisioning/dashboards/decree-overview.json | Pre-built Decree monitoring |
| Decree Run Detail dashboard | provisioning/dashboards/decree-run-detail.json | One run's routine.log and message.md, by message ID |
Grafana re-reads the dashboards directory every 30 seconds, so a dashboard JSON edit lands without a restart. Datasource provisioning is applied at startup only — restart grafana after editing a datasource YAML.
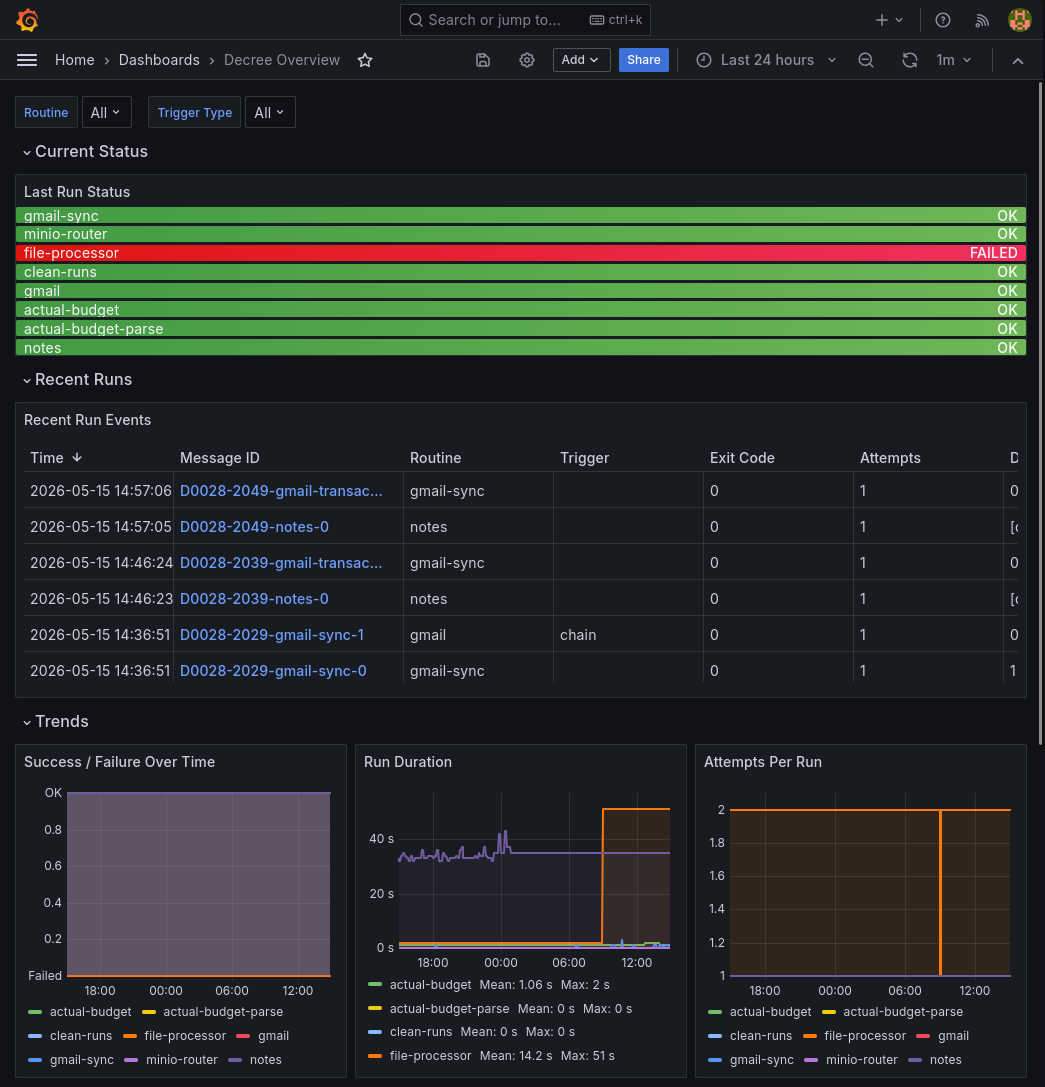
Decree Overview dashboard
Covers the Decree automation engine, filterable by routine and trigger_type template
variables, with panels for:
- Current Status — last run success/failure per routine (Prometheus gauge)
- Recent Run Events — a table of every run (Loki), one row per attempt: message ID (linking to the Run Detail dashboard below), routine, subroutine (which specific file processor / department / etc. a routine dispatched to, when it says so — sparse by design), trigger, exit code, attempts, duration, and whether it was the final attempt
- Trends — success/failure, duration, and attempts-per-run over time (Prometheus, timeseries)
- Logs — a raw, filterable Loki log stream of routine output
This is the main place to check when a Decree automation fails or behaves unexpectedly.
Extending
- New dashboard: drop a JSON export into
hosting/grafana/provisioning/dashboards/. Grafana auto-loads it. - New datasource: add a YAML file to
hosting/grafana/provisioning/datasources/. - Alerts: unified alerting only, configured in the Grafana UI — rules persist in the
grafana_datavolume. Legacy alert rules embedded in dashboard JSON were removed in Grafana 11. Alerting rules are not provisioned from files here; onlydatasources/anddashboards/are bind-mounted.
Data flow summary
Decree run
  └─ afterEach.sh
       ├─ Pushgateway → Prometheus (metrics: success, duration, attempts)
       └─ Loki push API (log: structured summary line)

automation/runs/**/routine.log
  └─ Alloy → Loki (full routine output, labeled by message_id/chain/seq)

Grafana
  ├─ queries Prometheus for metric panels
  └─ queries Loki for log panels